
FIGURE 2.
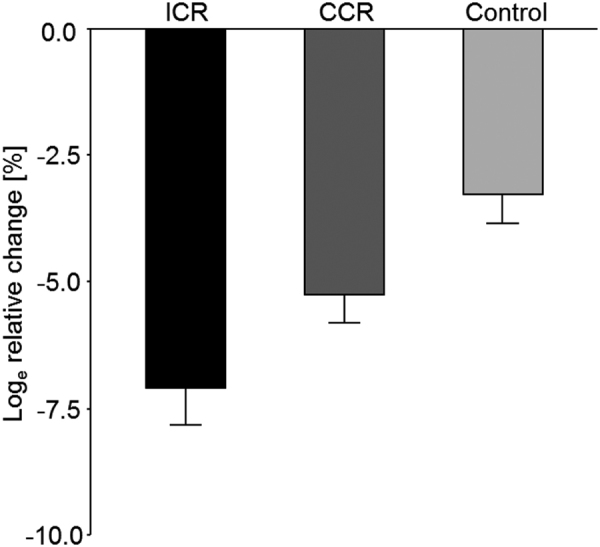
Changes in body weight by study group across the 12-wk intervention phase. Data are shown as mean ± SEM loge relative changes, with baseline values as the reference for the ICR group, CCR group, and control group (n = 150). Linear mixed models showed a significant time-by-treatment interaction across all 3 study groups (P < 0.001) and for the 2-group comparisons of ICR with Control (P < 0.01) and CCR with Control (P < 0.01); the difference between ICR and CCR was borderline significant (P = 0.053). CCR, continuous calorie restriction; ICR, intermittent calorie restriction.