Fig. 3.
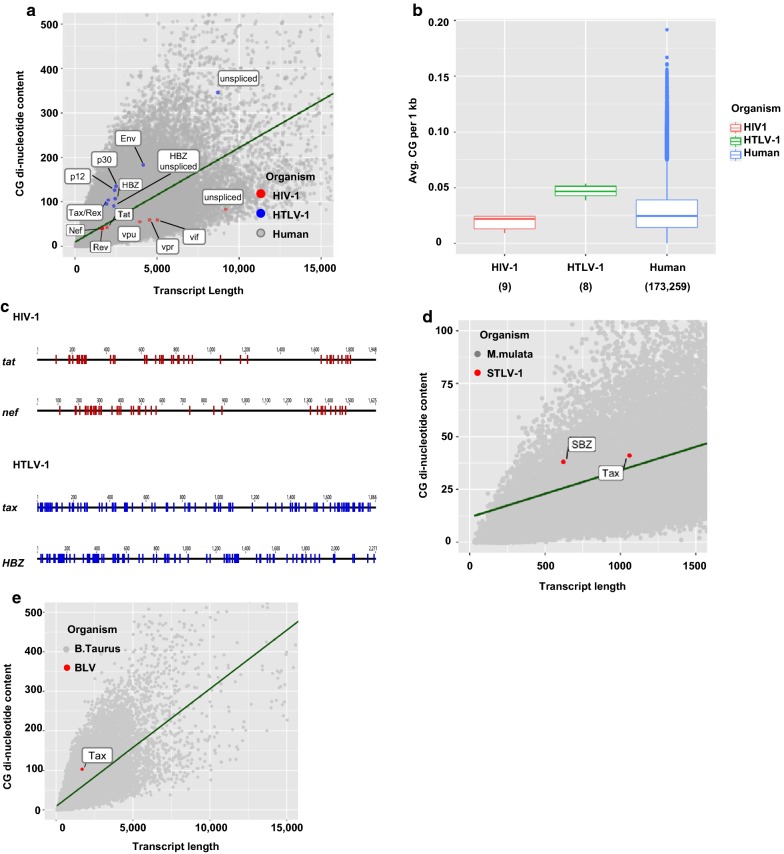
HTLV-1 transcripts show a higher content of CG di-nucleotides. a The CG dinucleotide content of HIV-1 (red dots), HTLV-1 (blue dots), and human (grey dots) transcripts is shown in correlation with the transcripts’ lengths. HIV-1 mRNAs used in this analysis are shown in Additional file 1: Table S4 [56]. b The average number of CG di-nucleotides per kb of transcript is shown for the same organisms. Numbers in parentheses indicate the total number of transcripts considered for the calculation. c Individual CG dinucleotides are shown for viral transcripts. Blue: HTLV-1, red: HIV-1. d Proportion of CG-dinucleotides in relation to transcript length for STLV-1 (NCBI GenBank: JX987040.1) and monkey (Macaca mulatta) genomes. To visualize the difference between average value and STLV-1 Tax, expanded version of the graph is shown. e Proportion of CG-dinucleotides in relation to transcript length for BLV and bovine (Bos taurus) genomes

