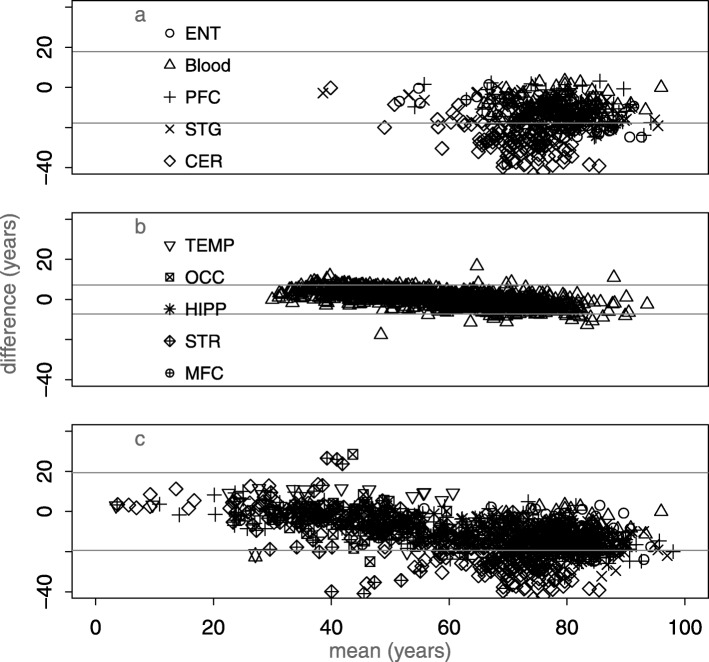
Fig. 2.
Mean-difference (Bland-Altman) plots showing the difference between Horvath model age and chronological age. a Elderly brain: AD data set [9], b population blood sample [10], and c additional publicly available datasets (see Additional file 1: Table S1). The horizontal lines in each case are at ± 1.96 * sd; for normally distributed difference due to error 5% of points would lie outside these and in each case many more do

