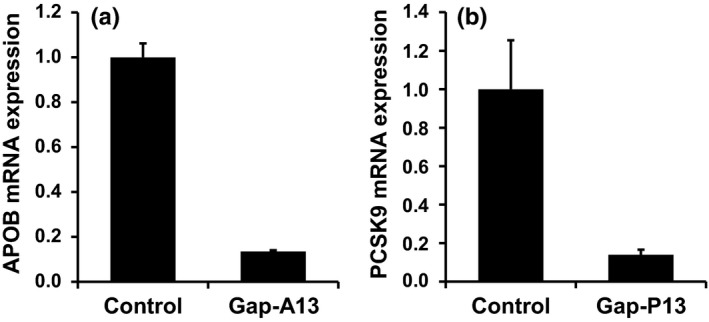
Figure 2.

The expression level of the target genes analyzed with qRT‐PCR. (a) The mRNA expression level of the target gene, APOB, in gap‐A13‐treated cells. (b) The mRNA expression level of the target gene, PCSK9, in gap‐P13‐treated cells. The bar graph shows the mean ± standard deviation (n = 4)
