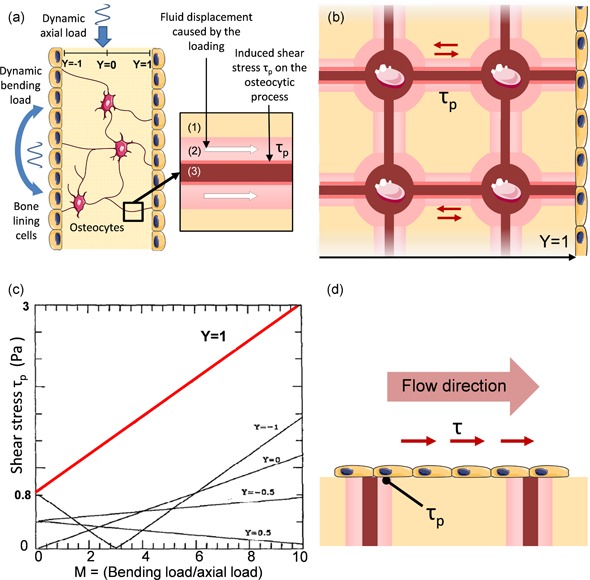
Figure 6.

Weinbaum lacunar–canalicular porosity model. (a) Diagram showing a simplified trabecular cross‐section with bone lining cells and osteocytes submitted to oscillatory axial and bending loads as studied by Weinbaum et al. (1994). The fluid displacement caused by the loading in the periosteocytic space (1) of the canaliculi (2) generates shear stress on osteocytic processes (3). (b) Scheme illustrating the idealized Weinbaum's model of a trabecular cross‐section where the shear stress amplitude on the membrane surface of the osteocytic processes τp is calculated for different depths Y. (c) Plot of the maximum τp as a function of the bending to axial load ratio at different locations Y. The known 0.8–3 Pa range (in red) corresponds to the periodic maxima at Y = 1 for M ranging between 1 and 10 (from Weinbaum et al., 1994). (d) Difference between τp at Y = 1 and the shear stress τ applied to the cell surfaces
