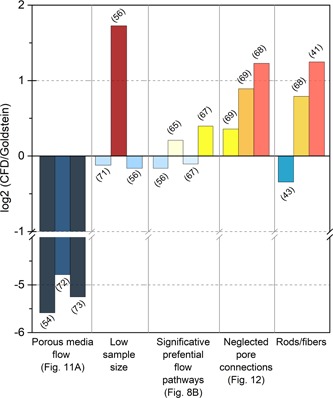
Figure 10.

Goldstein approximation robustness. Histogram of the log2 ratio of the computational fluid dynamics (CFD)‐generated shear stress values over the average shear stress in the scaffold predicted by the Goldstein approximation. Log2 values vary between −5.5 and 1.8, indicating that depending on the study, the Goldstein approximation gives shear stress values ranging from 45 times lower (Kleinhans et al., 2015) to three times higher (McCoy et al., 2012) than those predicted by CFD
