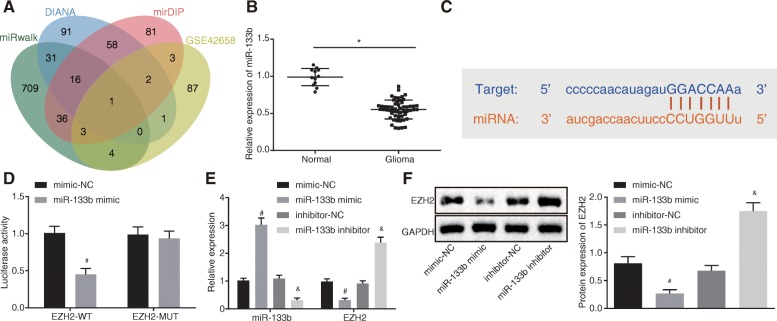
Fig. 3.
miR-133b targets and negatively regulates EZH2. a Venn analysis of miRNAs that regulate EZH2; blue represents the predicted results of DIANA database, red represents the predicted results of mirDIP database, green represents the predicted results of mirWalk database, and yellow represents the differentially expressed downregulated miRNAs in GSE42658. b miR-133b expression in normal brain tissues (n = 12) and glioma tissues (n = 54) determined by RT-qPCR. c Binding site prediction of miR-133b in EZH2 3′UTR. d Detection of luciferase activity using dual-luciferase reporter gene assay. e miR-133b expression and EZH2 mRNA level after miR-133b over-expression and inhibition using RT-qPCR. f EZH2 protein level after miR-133b over-expression and inhibition using Western blot analysis; *p < 0.05 vs. normal brain tissues; #p < 0.05 vs. glioma cells treated with mimic-NC; &p < 0.05 vs. glioma cells treated with inhibitor-NC; measurement data were shown as mean ± standard deviation; comparisons between two groups were conducted by unpaired t test, and comparisons among multiple groups were assessed by one-way analysis of variance (Dunnett’s post hoc test). The experiment was repeated three times to obtain the mean value

