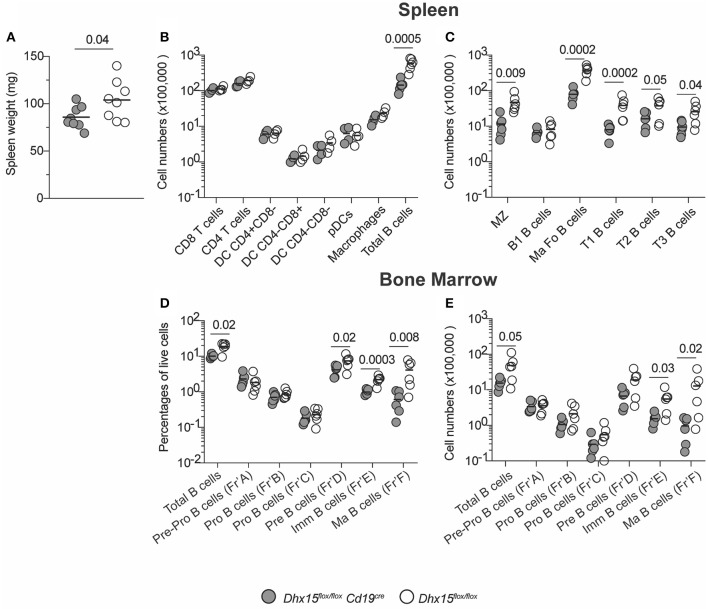
Figure 2.
B cell lymphopenia in DHX15 B cell conditional KO mice. (A) Spleen weight in mg from experimental (filled symbols) and negative littermates (opened symbols). (B) Immunophenotyping of the spleen. Cell numbers were defined by the percentages of CD45+Singlets+Live gate+ (Total cells). Additional leukocyte gates were defined as followed: T cells (CD3+B220−CD19−), B cells (B220+CD19+CD3−), DCs (CD11c+CD19−CD3−F4/80−), pDCs (DCgate+CD11cintB220+), and macrophages (F4/80+CD19−CD3−CD11c−). (C) Spleen B cell populations were defined according to Supplementary Figure 3A. (D,E) Bone marrow immunophenotyping. B cell development fractions were determined using Supplementary Figure 3B gating strategy. Percentages and total numbers were relative to the Live gate+ Singlets+ FSC-A/SSC-A gate. Total bone marrow cell numbers were relative to two fibulas per mouse. Each symbol represents an individual animal, from the combined results of 3–4 experiments. Animals were 8–14 weeks of age, and from both sexes. Statistical analysis was performed with R studio using the multiple linear regression function and the following equation: rank(Variable Y)~Genotype + Sex + Replicate. Only P values smaller than 0.05 were reported.

