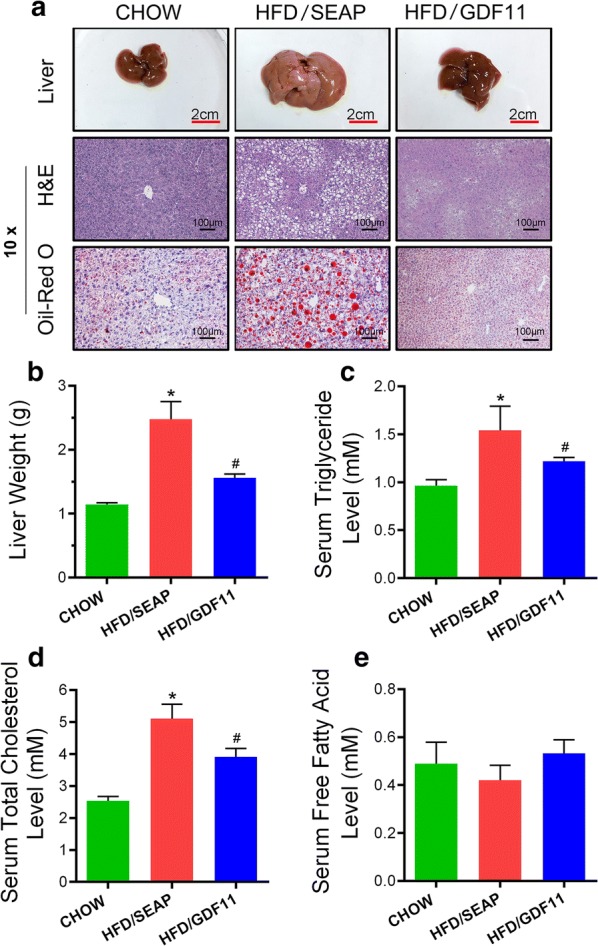
Fig. 4.

Gdf11 gene transfer blocked HFD-induced fatty liver. Animals fed different diets and injected with different plasmids were euthanized at the end of the feeding period, liver samples were collected and analyses were performed. a Representative images of mouse livers, and histological presentations of the liver sections; b liver weight; c serum concentrations of triglyceride; d serum cholesterol level; and e serum free fatty acid level. The scale bars in H&E staining represent 100 µm. The scale bars in photo of liver represent 2 cm. Data represent mean ± SEM (n = 5). *P < 0.05 comparing to mice fed a Chow diet; #P < 0.05 comparing to mice fed an HFD and injected with pLIVE-SEAP plasmids
