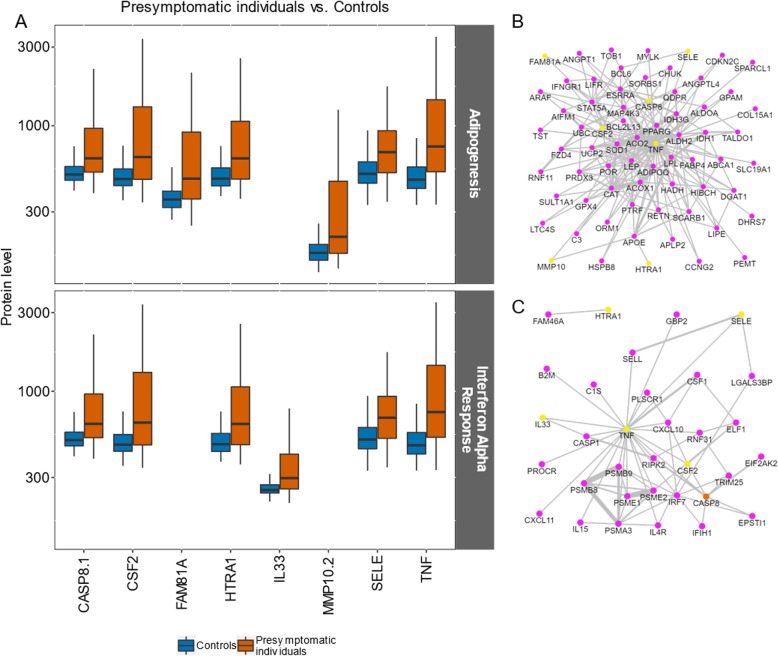
Fig. 2.
The proteins behind the enrichment toward the hallmark gene sets adipogenesis and interferon alpha in pre-symptomatic individuals and controls. a Protein abundance levels (log10) in controls vs. pre-symptomatic individuals; the upper panel shows proteins are related to adipogenesis, while the lower panel relates to the interferon alpha gene set. Boundaries of the box indicating Q1 to Q3, vertical black line as the median and whiskers according to Tukey. b, c Subnetworks extracted from the global Pathway Commons network (version 9, Cerami et al. [23]): links connecting AGS proteins (yellow) with proteins of b adipogenesis and c interferon alpha FGSs. The orange color indicates proteins found in both AGS and FGS. This and subsequent analyses were performed on the online NEA resource evinet.org [29]. Confidence of the network links (= line thickness) was ignored by the NEA algorithm

