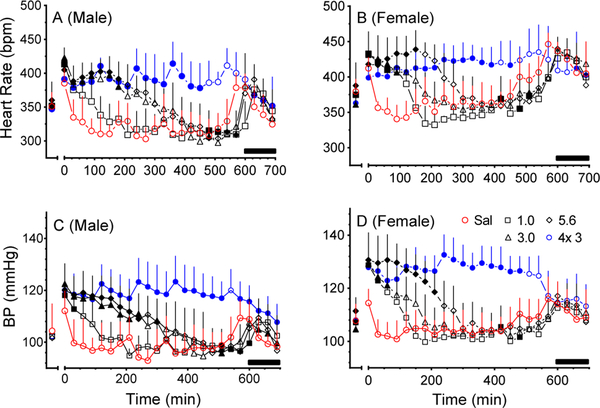
Fig. 1:
Heart rate (A,B) and mean arterial BP (C,D) (+ SD) for male and female SD rats (n=7/sex) after IP injection of ascending, single doses (1–5.6 mg/kg MDPV) and binge dosing of MDPV (3 mg/kg MDPV x4 injections every 2 h). Black bars along the bottom right of the graph shows the dark cycle phase time (600 – 700 min). Data were collected 30 min prior to injection and for 22 h after dose administration, but only the first 700 min post-injection are shown. Statistical analysis was performed using a two-way ANOVA followed by Dunnett’s multiple comparison test to compare individual effects of drug treatment at each time point to saline control. Solid symbols indicate significant differences from saline (p<0.05).

