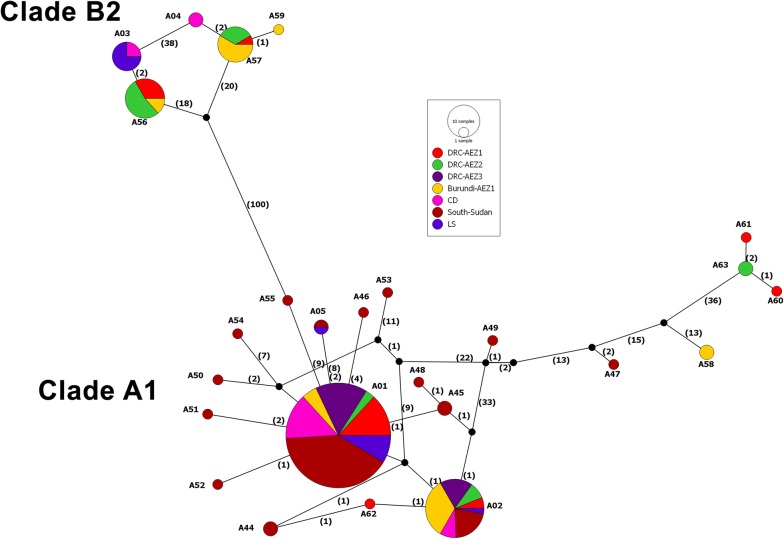
Fig. 6.
Median-joining network representing the phylogeographical distribution of Tp2 alleles of T. parva from cattle in sub-Saharan Africa. Each circle represents a unique allele, with colours depicting the proportion of individuals from different populations sharing the allele. Black nodes represent hypothetical unsampled alleles (or median vectors). Numbers in brackets on connecting lines indicate mutational steps between alleles. The detailed Tp2 alleles distribution and their corresponding populations/AEZs are presented in Additional file 10: Table S8. Tp2 allele A01 corresponds to samples identical to Muguga and Serengeti-transformed strains and Tp2 allele A02 represents samples identical to Kiambu-5 strain. CD, cattle-derived samples (from Kenya); LS, laboratory samples (ILRI) [36]

