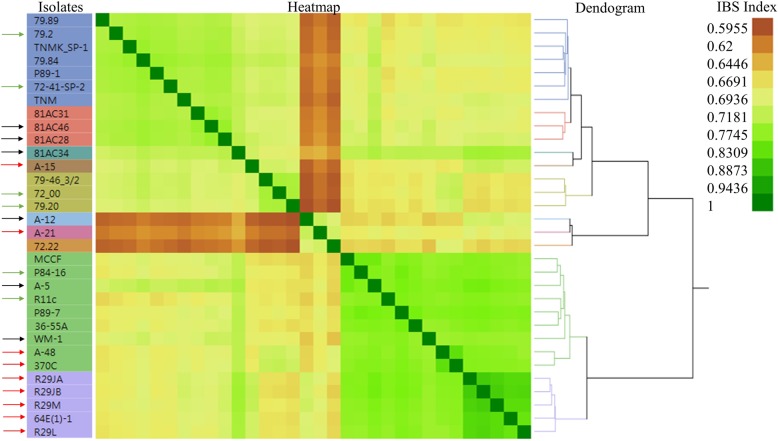
Fig. 1.
Heatmap and dendrogram of 32 Pgt isolates with differential virulence on barley lines with and without the stem rust resistance genes RMRL and/or Rpg1. Dendogram was obtained using hierarchical clustering (Fast Ward method) on the genotypic data generated for the 32 Pgt isolates used in this study. The colors of heatmap represents the relationship matrix [Identity by State (IBS)] value (shown on top right corner) that explain the degree of relatedness between the isolates. IBS with a value of 1 represents a perfect relationship and are dark red, while the decreasing IBS values represents increasing genetic diversity between two isolates compared. The isolates with an arrow on the left are the virulent RMRL (red arrows), virulent Rpg1 (green arrows) and avirulent RMRL and Rpg1 (black arrows) Pgt isolates selected for RNAseq analysis based on this diversity assay

