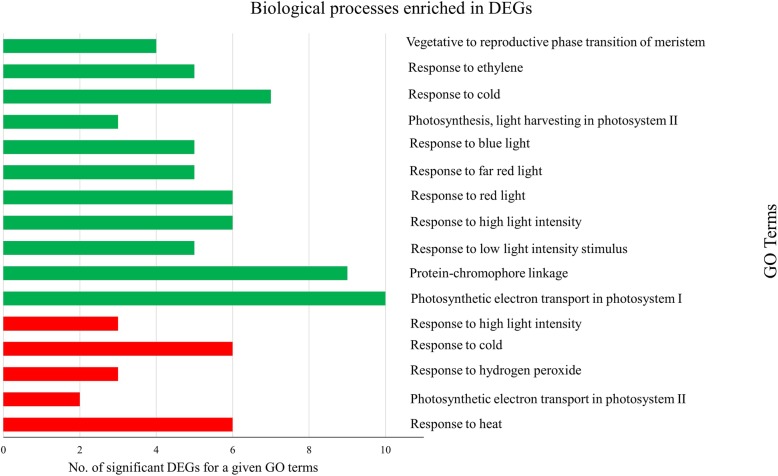
Fig. 3.
Bar graph showing the number of differentially expressed barley genes identified utilizing gene ontology (GO) enrichment analysis for involvement in specific biological processes. Red color represents genes that are expressed significantly higher and green color represents genes that are expressed significantly lower level in samples inoculated with RMRL virulent Pgt isolates when compared to RMRL avirulent Pgt isolates

