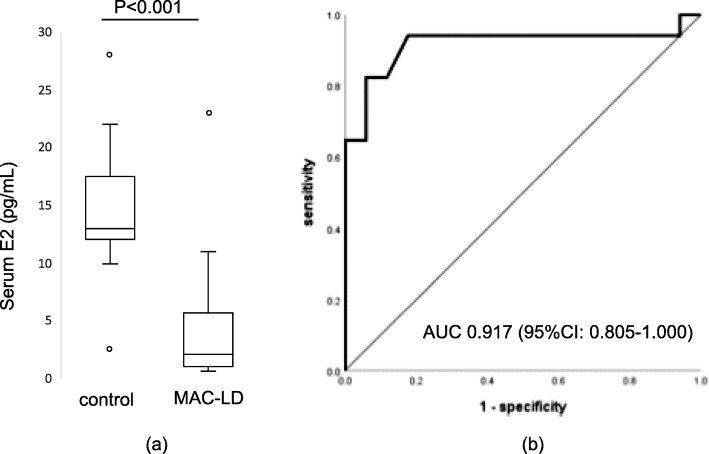
Fig. 3.
Results of age- and BMI-matched subgroup analysis. a Box plot* of serum estradiol of age- and BMI-matched MAC-LD patients and healthy controls. b ROC curve of estradiol serum levels in samples from age- and BMI-matched MAC-LD patients and healthy controls. Abbreviations: BMI = body mass index, MAC-LD = Mycobacterium avium complex lung disease, ROC = receiver operating characteristics, AUC = area under the curve, CI = confidence interval. *Mann-Whitney U test

