Fig. 1.
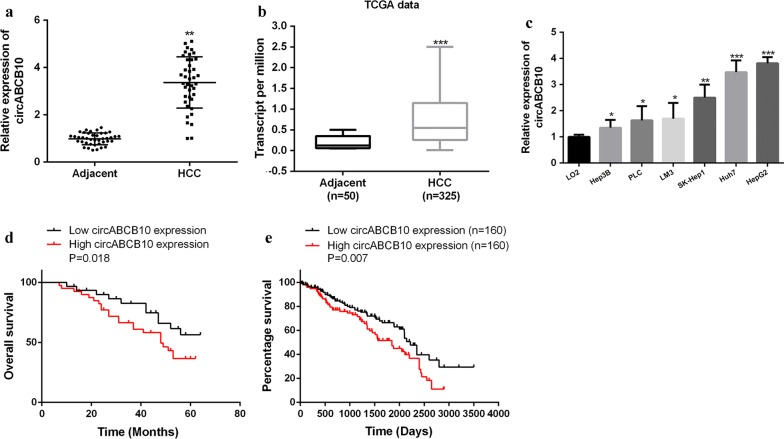
Expression of circABCB10 in HCC. a Expression levels of circABCB10 in matched adjacent normal tissues and HCC tissues (n = 40). P < 0.01 by Wilcoxon test. b Expression levels of circABCB10 in HCC tissues (n = 325) and normal liver tissues (n = 50) in TCGA data from UALCAN (http://ualcan.path.uab.edu). P < 0.001 by t-test. c Expression levels of circABCB10 in normal liver cell lines and HCC cell lines. P < 0.05, P < 0.01 and P < 0.001 by ANOVA. d Kaplan–Meier plot of HCC patients with low (n = 20) or high (n = 20) circABCB10 expression. P = 0.018 by Log-rank test. e Kaplan–Meier plot of HCC patients with low (n = 160) or high (n = 160) circABCB10 expression in TCGA data from OncoLnc (http://www.oncolnc.org/). P = 0.007 by Log-rank test. **P < 0.01, ***P < 0.001

