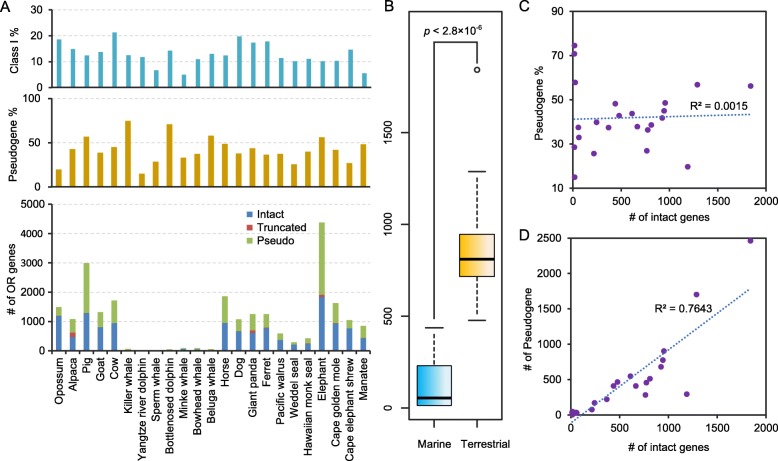
Fig. 1.
Comparison of the number of OR genes encoded in mammalian genomes. a Class I gene proportion refers to the number of intact Class I genes divided by the total number of all intact OR genes in the species. Pseudogene proportion refers to the number of pseudogenes divided by the total number of OR genes in the species. The OR gene information of opossum was obtained from [16]. b Number of intact OR genes was compared between marine mammals and terrestrial mammals using the Mann-Whitney U test (p value < 2.8 × 10− 6). c Significant correlations were not observed between the proportion of OR pseudogenes in each genome and the number of intact OR genes (Pearson's correlation coefficient r = 0.039; p value = 0.86). d Absolute number of OR pseudogenes was positively correlated with the number of intact genes (r = 0.874; p value = 4.99 × 10− 8)

