Fig. 3.
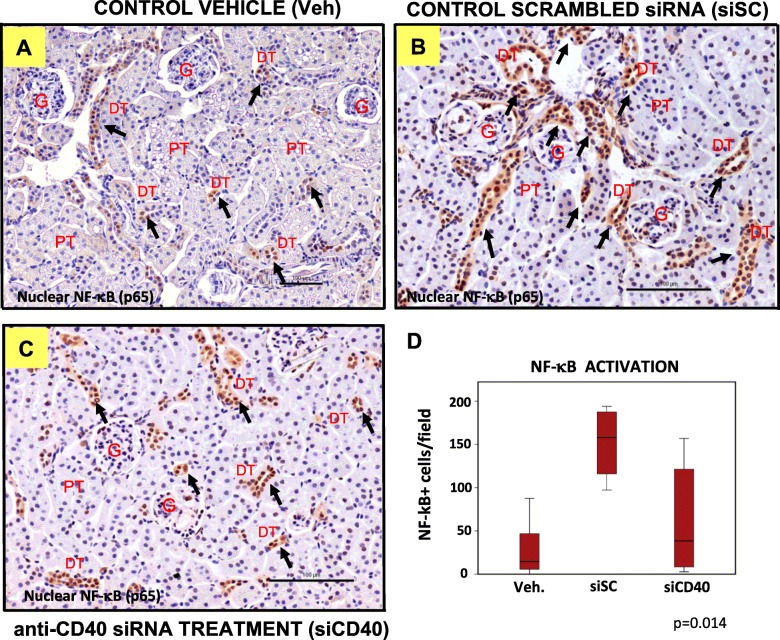
Anti-CD40 siRNA treatment increases NF-κB activation in the kidneys of treated mice. NF-κB-p65 Representative images of NF-κB-p65/haematoxylin staining of kidney sections from ApoE−/− mice treated with: a control vehicle (veh), b a control sequence-scrambled siRNA (siSC), or c the anti-CD40 siRNA (siCD40), at 200x magnification (Scale bars are100 μm). A number of positive cells are marked by arrows. G shows the renal glomeruli, PT shows some proximal tubules characterized by large cells with an apical brush border (not all nuclei are visible in the cross-section) and DT shows some distal tubules with smaller cells. d Box-plot showing the number of NF-κB-p65 + cells per kidney section. Each diagram represents the median, quartiles and outliers. The colored box represents the interquartile range that contains 50% of the values. The whiskers are lines that extended from the box to the highest and lowest values, excluding outliers. A line across the box represents the median value. Kruskal Wallis test

