
Fig. 4.
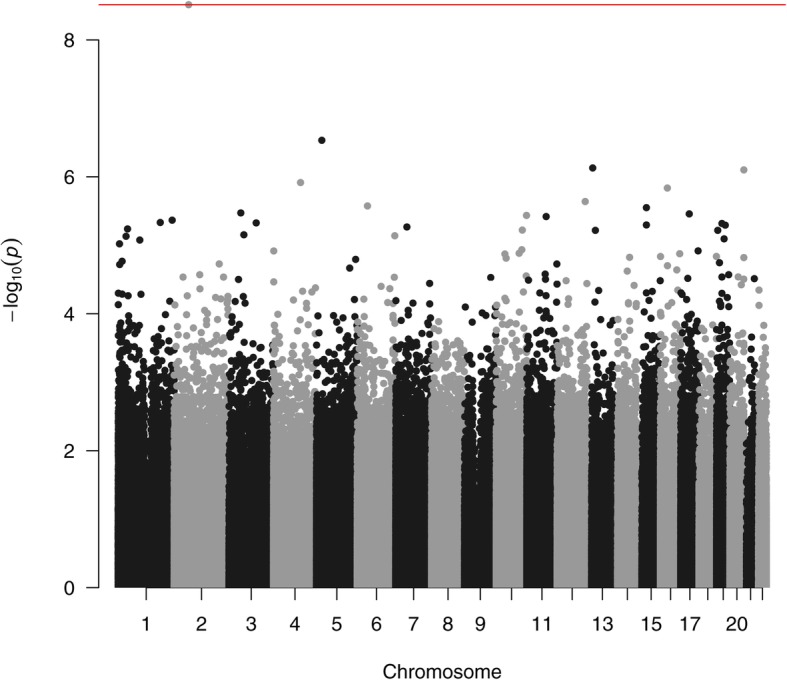
Manhattan plot of the differentially methylated CpG sites in the comparison of T21 patients with low and high IQ. The red line denotes the least significant site surviving multiple testing
Official websites use .gov
A
.gov website belongs to an official
government organization in the United States.
Secure .gov websites use HTTPS
A lock (
) or https:// means you've safely
connected to the .gov website. Share sensitive
information only on official, secure websites.
Manhattan plot of the differentially methylated CpG sites in the comparison of T21 patients with low and high IQ. The red line denotes the least significant site surviving multiple testing