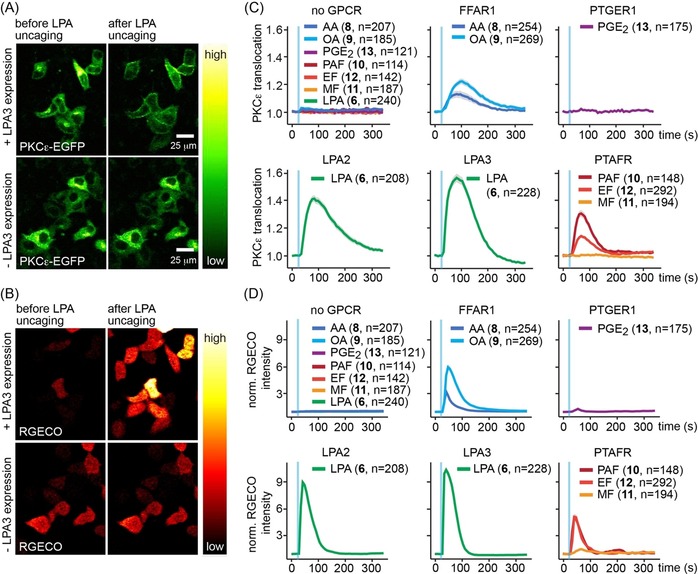
Figure 3.

Photo‐caged compounds enable optical control of GPCR mediated signal transduction. (A,B) Cellular localization of PKCϵ‐EGFP (A) and RGECO fluorescence intensity (B) before and after uncaging of LPA from 6 in HeLa Kyoto cells with (upper panels) or without overexpression (lower panels) of the LPA receptor LPA2. Scale bars indicate 25 μm, images for the same conditions in a and b show the same cells. (C,D) Quantification of PKCϵ‐EGFP recruitment (C) and RGECO fluorescence intensity (D) upon uncaging of caged arachidonic acid (8), caged oleic acid (9), caged prostaglandin E2 (13), caged lysophosphatidic acid (6), caged platelet activating factor (10), caged edelfosin (12) and caged miltefosin (11) in HeLa Kyoto cells transiently expressing the corresponding GPCRs (FFAR1, PTGER1, LPA2, LPA3, PTFAR). Upper left panels depict the quantification of PKCϵ‐EGFP recruitment (C) and RGECO fluorescence intensity (D) upon uncaging of all compounds in HeLa Kyoto cells without GPCR expression as negative control. Blue bars indicate uncaging events, data are mean, shaded areas indicate SEM, n‐numbers are given in brackets behind compound identifiers and indicate single cell traces.
