Figure 3.

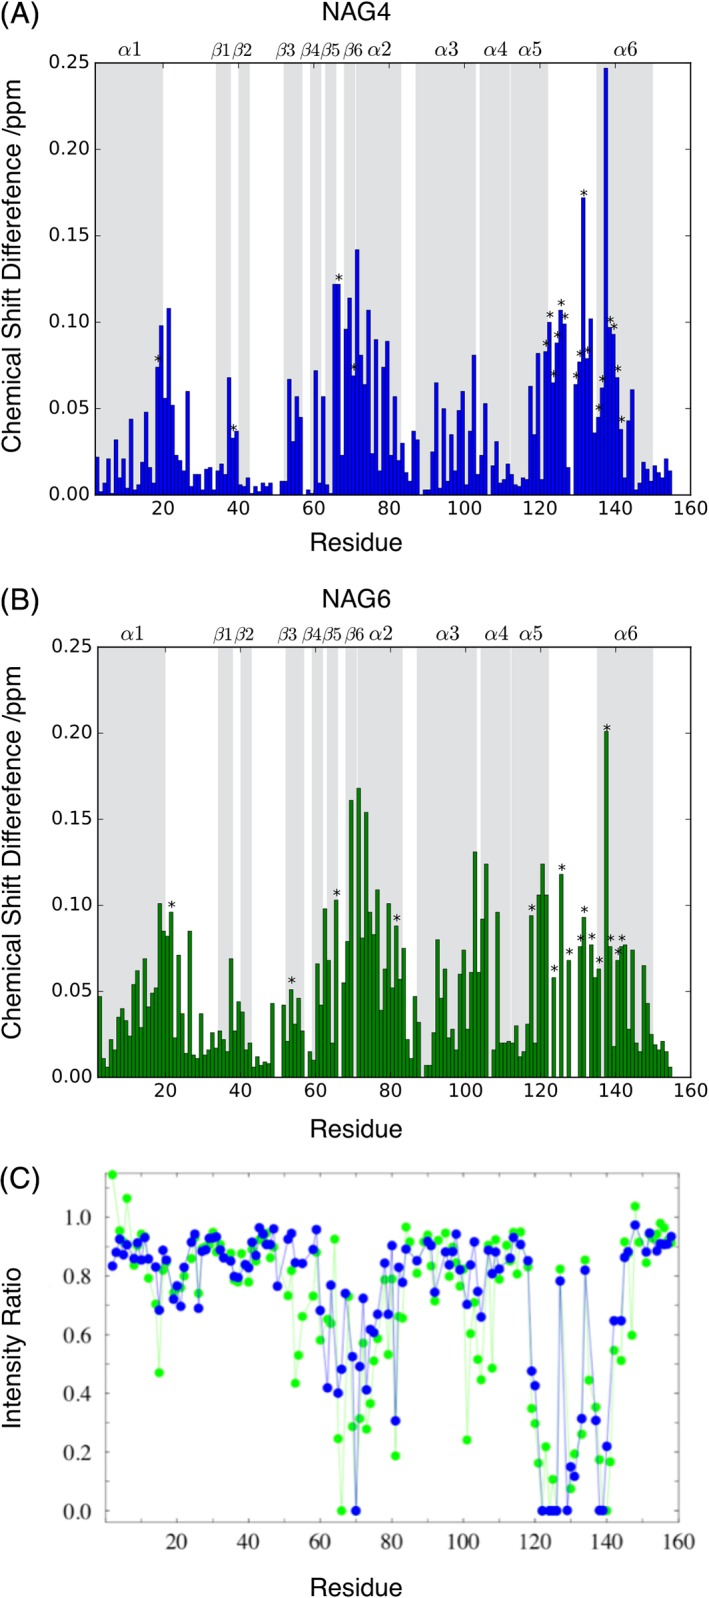
Comparison of chemical shift differences and peak broadening observed with NAG4 and NAG6. Combined 1HN‐15N chemical shift difference between apo λ lysozyme and λ lysozyme in complex with ~6 mM NAG4 (A) and ~6 mM NAG6 (B). The chemical shift differences of peaks that disappear from spectra have been extrapolated, where possible, using the experimental K d value and are indicated with an asterisk. Regions of secondary structure in λ lysozyme are shown in gray and labeled at the top of each plot. C, HSQC peak intensity for λ lysozyme observed with ~1 mM NAG4 (blue) or NAG6 (green) relative to intensity observed for apo λ lysozyme. Peaks that broaden beyond detection have an intensity ratio of 0 [Color figure can be viewed at http://wileyonlinelibrary.com]
