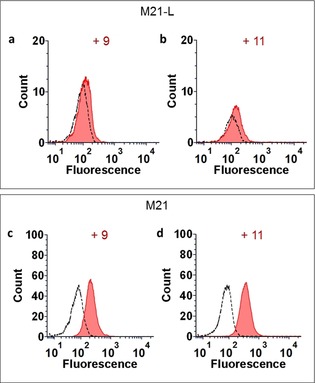
Figure 2.

Evaluation of the binding of the fluorescent TBMs 9 and 11 (5 μm, red) to M21 (high levels of integrins) and M21‐L (low levels of integrins) cells by flow cytometry. a) Binding of 9 to M21‐L. b) Binding of 11 to M21‐L. c) Binding of 9 to M21. d) Binding of 11 to M21. The autofluorescence of the cells is represented with dashed lines.
