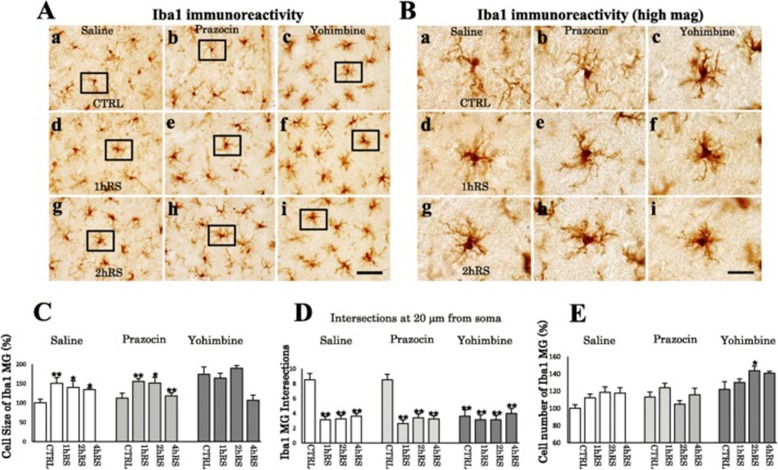
Fig. 10.
A Iba1 IHC for CTRL (a–c), 1 h RS (d–f), and 2 h RS (g–i) after saline and α-blocker treatment, respectively. B Enlargement of the boxed areas in A. Scale bar: 50 μm in A and 20 μm in B. C Histogram demonstrating the cell size of Iba1-ir microglia in the HT at CTRL, 1 h RS, and 2 h RS following saline and α-blocker treatment. D Histogram showing the intersections count. E Histogram demonstrating the cell count of Iba1-ir microglial cells in the HT at CTRL, 1 h RS, and 2 h RS following saline and α-blocker treatment. The asterisks indicate a statistical difference between CTRL and stressed rats (*p < 0.05, **p < 0.01, n = 4)

