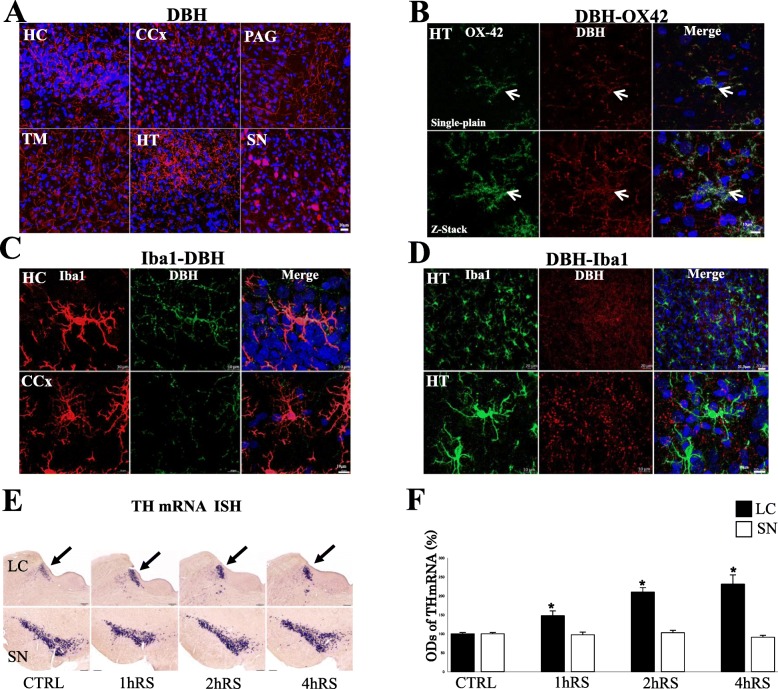
Fig. 3.
a DBH immunofluorescence staining in the HC, TM, CCx, HT, CAG and SN. Scale bar: 10 μm. b Double-immunofluorescence staining with DBH (red) and OX-42 (green) in the HT. Upper panels show single-plain images, lower panels showing Z-stack analysis with DBH-ir fibers drawing OX-42-ir microglia as indicated by arrows. Scale bar: 10 μm. c Double-immunofluorescence staining with DBH (green) and Iba1 (red) in the HC and CCx. Scale bar: 10 μm. d Double-immunofluorescence staining with Iba1 (green) and DBH (red) in the HT, with upper panels at low-power and lower panels at high-power, respectively. Scale bar: 20 μm (upper panels) and 10 μm (lower panels). e Th mRNA in situ hybridization in the LC and SN following acute RS as compared to control conditions. Scale bar: 200 μm. f Histogram demonstrating the optic densities (O.D.s) of Th mRNA in the LC (black) and SN (white) at each time point (*p < 0.05, **p < 0.01, n = 4)

