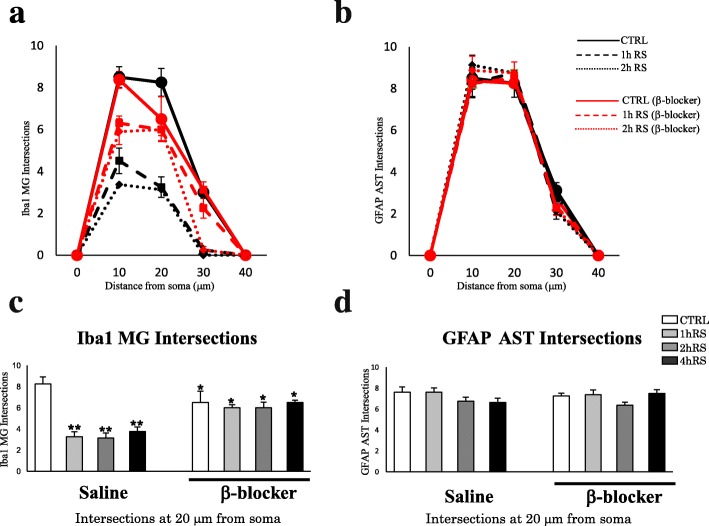
Fig. 8.
a, b Scholl analysis of microglia and astrocytes in the HT at CTRL, 1 h RS, and 2 h RS, respectively, as compared to β-blocker treatment. c, d Histograms demonstrating the intersections count of Iba1-ir microglia (c) and GFAP-ir astrocytes (d) at the distance of 20 μm from soma. The asterisks indicate a statistical difference between saline-treated and β-blocker-treated rats at each time point (*p < 0.05, **p < 0.01, n = 4)

