
Figure 3.
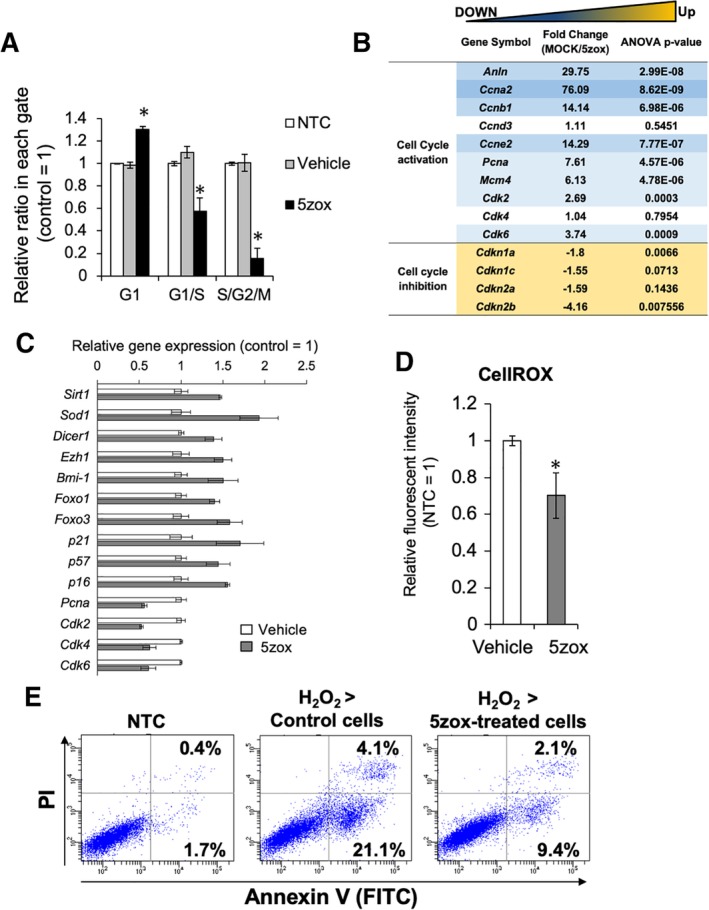
Analysis of cell cycle status in the bone marrow‐derived mesenchymal stem cells (BMMSCs) treated with 5zox. (A): FACS‐based quantification of cell numbers in the BMMSCs treated with vehicle (same amount of DMSO) and 5zox by the fucci G1‐orange/S/G2M‐green system. Asterisks represent significant differences (p < .05, n = 3) compared with control. (B): Expression change in the genes associated with cell cycle regulation found by microarray analysis. (C): qRT‐PCR analysis for the expression change of the quiescence‐related genes. Significant differences between nontreatment control and 5zox were detected in all genes represented here (p < .05, n = 3). (D): Reactive oxygen species detection with CellROX dye and FACS. Asterisks represent significant differences (p < .05, n = 3) compared with vehicle control. (E): Detection of apoptosis/necrosis by PI/Annexin V (AnV) staining. PI/AnV double‐positive population indicates cell population undergoing necrosis or late apoptosis. PInegative/AnV positive fraction indicates cell population undergoing necrosis or early apoptosis.