
FIGURE 4.
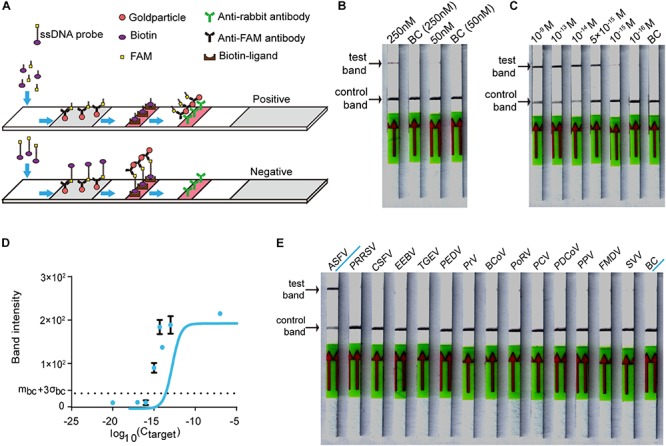
Establishing the CORDS assay. (A) Schematic diagram of the CORDS assay. (B) Optimization of the concentration of LbCas12a. (C) Sensitivity of the CORDS assay. (D) Mean gray values of the test band at different dsDNA target concentrations. The dashed line mbc + 3σbc indicates the positive cut-off. (E) Specificity of the CORDS assay. BC: blank control.