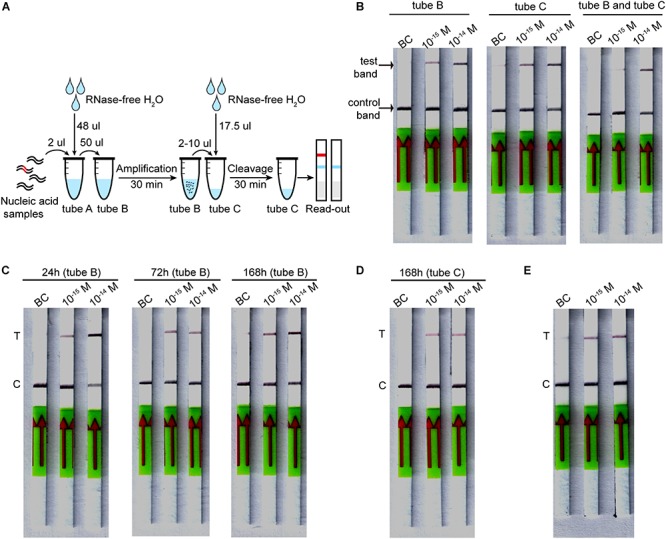
FIGURE 5.

Lyophilized CORDS assay. (A). Workflow for the lyophilized CORDS assay. (B) Verification of tubes B and C. (C) Accelerated stability test on tube B at 37°C. (D) Accelerated stability test on tube C at 4°C. (E) Reduction of the incubation time for LbCas12a cleavage. T and C in panels (C–E) represents the test and control bands, respectively.
