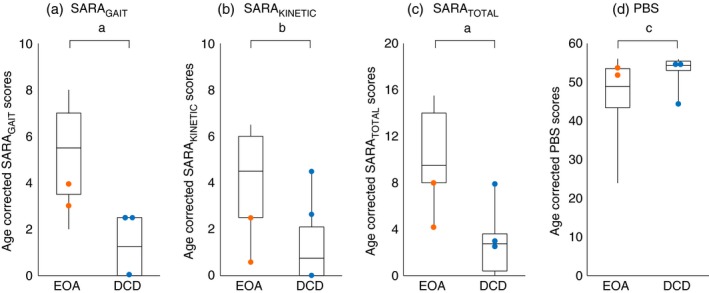
Figure 2.

Motor profiles of age‐corrected Scale for Assessment and Rating of Ataxia (SARA) and Paediatric Balance Scale (PBS) scores for children with early‐onset ataxia (EOA) and developmental coordination disorder (DCD). The orange and blue dots indicate patients with an inhomogeneous phenotype (EOA, orange; DCD, blue). a–d: patients with an inhomogeneous phenotype tended to reveal overlapping SARAGAIT (a), SARAKINETIC (b), SARATOTAL (c), and PBS scores (d). Patients with EOA revealed the highest SARA (sub)scores. The box plots represent the median and first and third quartiles of the scores; the whiskers represent the minimum and maximum of the scores (negative age‐corrected SARA values are indicated as 0 and age‐corrected PBS scores >56 are represented as 56). a p<0.001, b p<0.01, c p<0.05.
