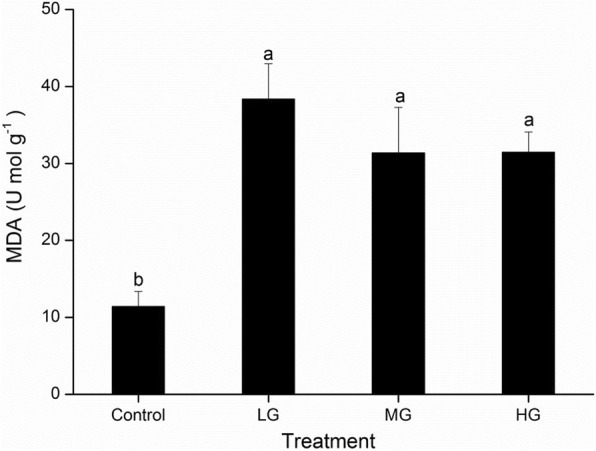
Fig. 6.

Leaf Malondialdehyde (MDA) content of L. chinensis in the different grazing intensity plots. (control, no grazing; LG, light grazing; MG, medium grazing; HG, heavy grazing). Values are means ± SE (n = 3). Values of a parameter labeled with different letters differ significantly between grazing intensities (ANOVA followed by LSD test, P < 0.05)
