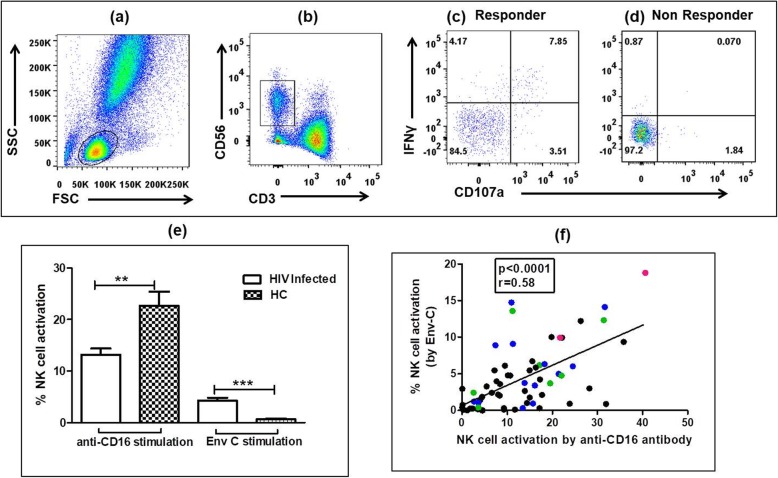
Fig. 1.
Anti-HIV ADCC measured by NK cell activation (the sum of the percentage of activated NK cells, expressing only CD107a or IFN-γ, or both CD107a and IFN-γ) in study participants. a-d: Flow cytometry plots showing the gating strategy used a Lymphocytes were gated based on FSC and SSC and b NK cells were identified as CD3-CD56+ cells and were assessed for CD107a or IFNγ expression or dual expression. Figures c and d shows representative plots showing NK cell activation observed in c HIV-1 Env-C responder and d HIV-1 Env-C non-responder e Bar graph shows % NK cell activation by anti-CD16 antibody and HIV-1 Env-C stimulation in HIV infected individuals and healthy controls (HC) f Scatter plot shows correlation between % NK cell activation by anti-CD16 antibody (X axis) and Env-C stimulation (Y axis) (Spearman r test) The FcγRIIIa genotypes associated with HIV-specific ADCC response have been identified as Green dots (V/V genotype), Blue dots (Y/H genotype) and red dots (V/V-Y/H genotype)

