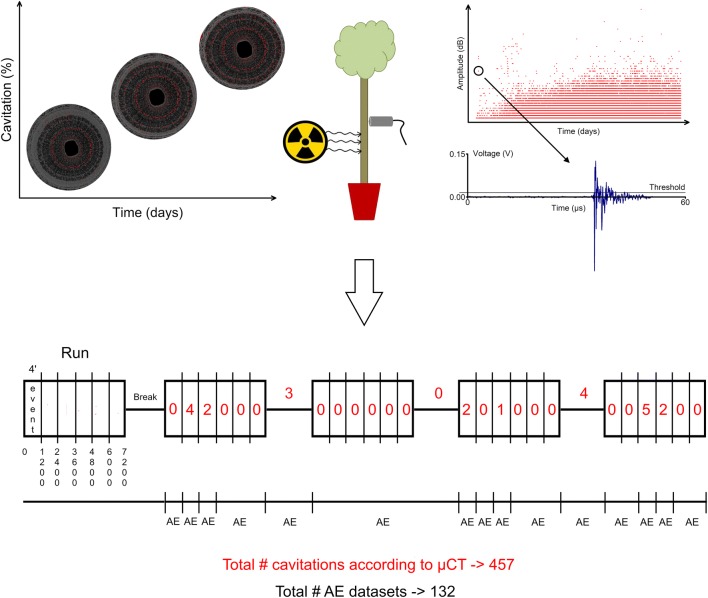
Fig. 8.
Schematic representation of how µCT images were processed and linked to AE signals. The left graph illustrates how embolism (red, %) spreads throughout 2D µCT cross-sections of Fraxinus excelsior L. as function of time (days). One stack consisting of 1000 2D µCT cross-sections resulted from reconstruction of 1200 projections collected over a time period of 4 min (event). Scans were consecutively taken over 24 min, resulting in one total scan run consisting of six events (i.e., 0–1200; 1200–2400; 2400–3600; 3600–4800; 4800–6000; 6000–7200; note that the number of projections per event are vertically displayed). A break was included between each run, and lasted 6 min during daytime runs and 30 min during evening and nighttime runs. The right graph shows the amplitude (dB) of all AE signals registered by sensor AE1 (closest to the scanning position) during progressive dehydration of the Fraxinus excelsior L. tree (time, days). Each dot in this graph represents the amplitude of one AE signal collected during dehydration. For each event and for the breaks between runs, µCT images were compared and analyzed for their total number of visually detected embolisms (red numbers), which totaled 457 at the end of the experiment. AE signals were grouped according to the time spans where embolism was detected or not detected, which resulted in 132 embolism and non-embolism AE datasets

