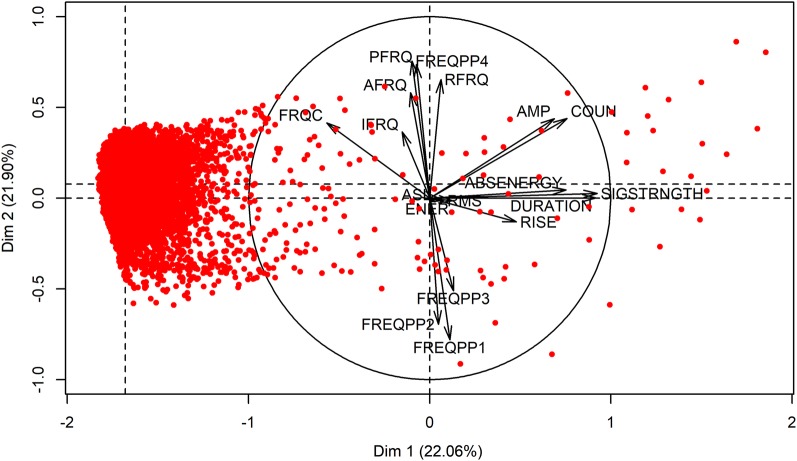
Fig. 9.
Individual AE signals (red) and AE waveform parameters (black arrows) factor map of the principal component analysis (PCA) executed on the entire AE dataset registered by sensor AE1 on Fraxinus excelsior L. during dehydration. Outliers separated from the major cluster correspond best with the number of embolism detected by µCT (457). AE waveform parameters ABSENERGY, DURATION, SIGSTRNGTH, COUN, and AMP (Table 4) are correlated with the first dimension explaining 22% of the data distribution, and AE parameter FREQPP2 (Table 4) negatively correlated with the second dimension explaining 22% of the data distribution

