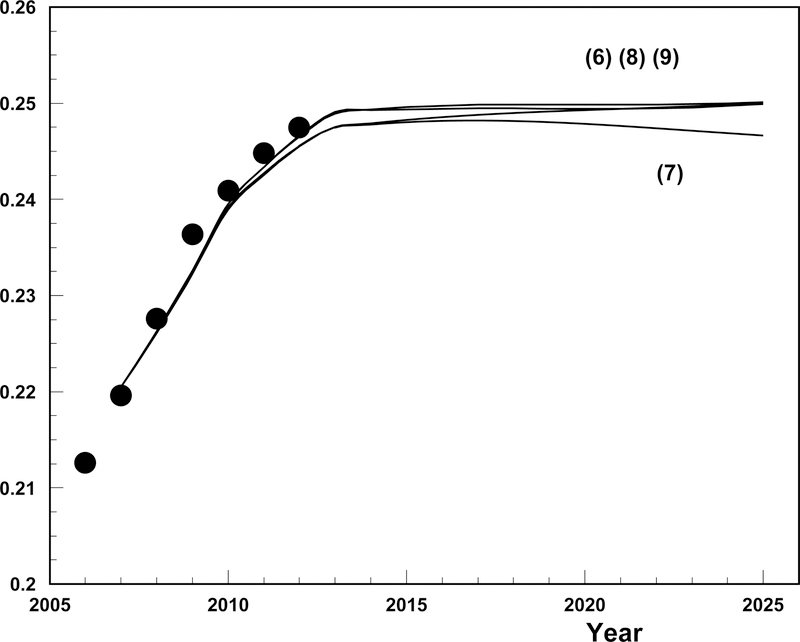
Figure 2.
Data (points) and projections of diabetes prevalence starting from 2008. Only data before 2008 are used for estimation. Empirical prevalence is shown by big dots. Four solid lines are projections using eqns. (6)–(9) using specifications of models for projections of coefficients: i) constant projections are used for initial prevalence, incidence, fractions , cause-specific and total (only for projections using eq. (7)); ii) Lee-Carter projections are used for mortality from healthy and unhealthy states as well as for total mortality for projections using eqs. (8) and (9); and iii) autoregression projection is used for hazard ratio. Further details and discussions of the specifications are described in the text.

