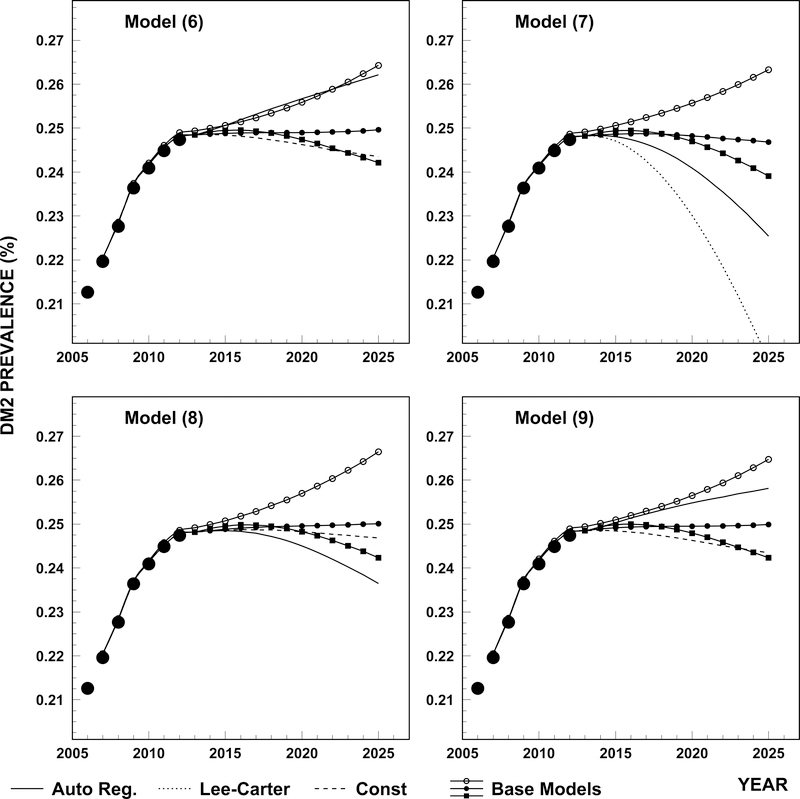
Figure 3.
Projections of T2D prevalence using different models (6)–(9) and different approaches for coefficient projections: i) base model in which coefficients are chosen as in Figure 2 (solid line with closed dots); ii) the base model in which initial prevalence is predicted using autoregression instead of constant model (solid line with open dots); iii) the base model in which incidence rate is predicted by Lee-Carter model instead of constant model (solid line with squares); iv) all measures (except initial prevalence) are obtained using autoregression (solid); v) all measures are obtained using Lee-Carter (dotted model), not applicable for models (8) and (9), almost coincide with approach iii) for eq. (6); and vi) all measures are obtained using constant model.

