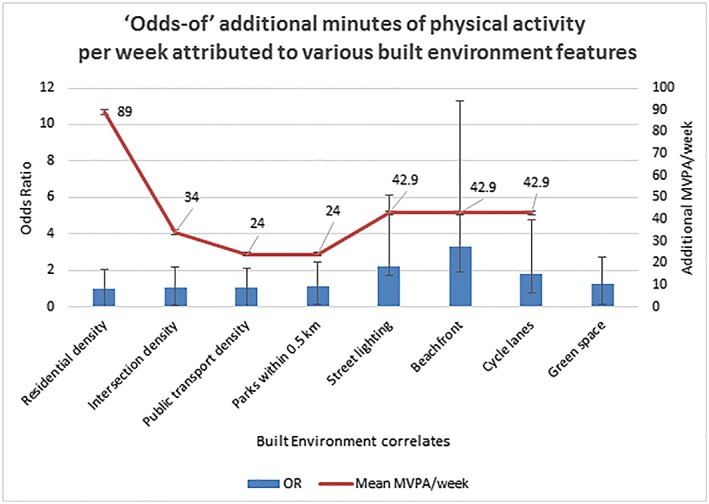
Figure 1.

“Odds‐of” additional minutes of physical activity per week attributed to various built environment features. Odds ratio/exp(b)—exponentiation of the coefficients (odds ratio for predictors) and increase in MVPA (moderate to vigorous physical activity) per week are plotted against various built environment features. Sallis et al38—Residential density, intersection density, public transport density, parks within 0.5 km. Da Silva et al79—Street lighting, beach front, and cycle lanes. James et al60—Green spaces
