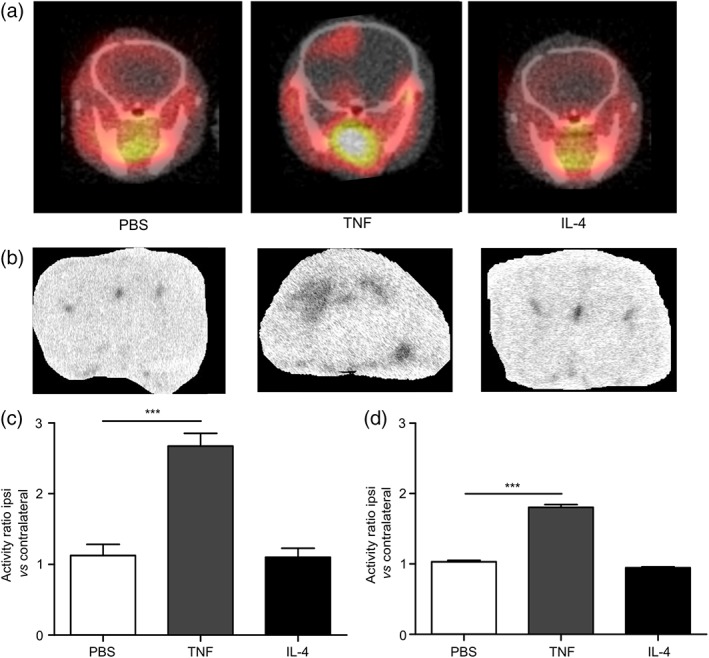
Figure 6.

In vivo PET imaging using 18F TSPO ligand shows increased TSPO binding after pro‐inflammatory TNF stimulation. (a) Representative coronal PET images acquired from mice injected intracerebrally in the left striatum with either PBS, AdTNF (pro‐inflammatory), or IL‐4 (anti‐inflammatory). Imaging was performed after intravenous 18F‐DPA‐713 injection, to visualize TSPO expression, at either 48 hr (PBS/IL‐4) or 5 days after intracerebral injection. (b) Representative autoradiography images from the same animals, obtained after PET imaging. (c) Graph showing ratios of TSPO binding activity in the injected (ipsilateral) versus contralateral hemisphere measured from the PET data. (d) Graph showing ratios of TSPO binding activity in the injected (ipsilateral) versus contralateral hemisphere measured from the autoradiography images. (n = 6; ANOVA followed by Dunnett's multiple comparison test, ***p < .001)
