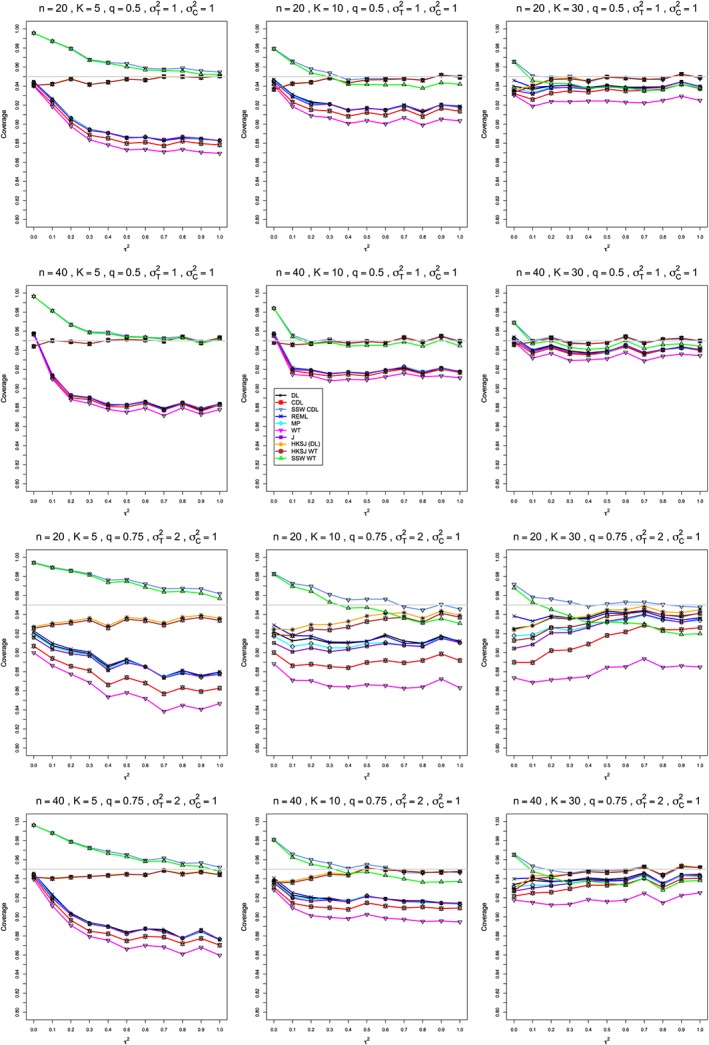
Figure 3.

Mean difference: Coverage of 95% confidence intervals for μ. The between‐studies variance τ 2∈[0,1]. In the top two rows, q=.5, , and . In the bottom two rows, q=.75, , and . Light gray line at 0.95. CDL, corrected DL; DL, DerSimonian‐Laird; HKSJ, Hartung‐Knapp‐Sidik‐Jonkman; J, Jackson; MP, Mandel‐Paule; REML, restricted maximum‐likelihood; WT, Welch‐type [Colour figure can be viewed at http://wileyonlinelibrary.com]
