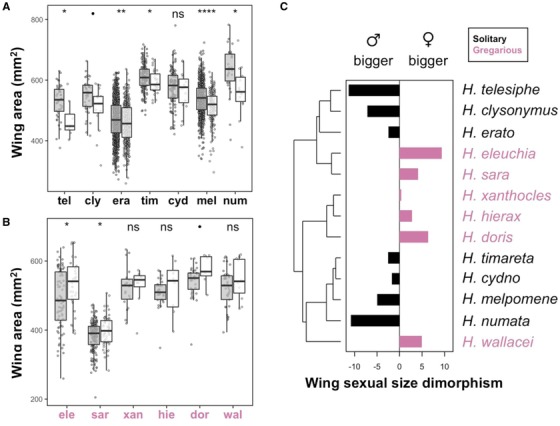
Figure 2.

Sexual wing area dimorphism across species and the phylogeny. (A) Wing size differences between males (grey) and females (white) of the seven single egg‐laying species and (B) the six gregarious species in this study. Error bars represent 95% confidence intervals of the means. Stars represent significance levels of two sample t‐tests between female and male wing areas for each species (•<0.1, *< 0.05, **<0.01, ***<0.001); for full t‐tests output, see Table S1. (C) Bar plot represents sexual size dimorphism calculated as percentage difference in female versus male size (positive means bigger females, right panel). Species with gregarious larvae are colored in pink, and those with solitary larvae are colored in black. [Color figure can be viewed at http://wileyonlinelibrary.com]
