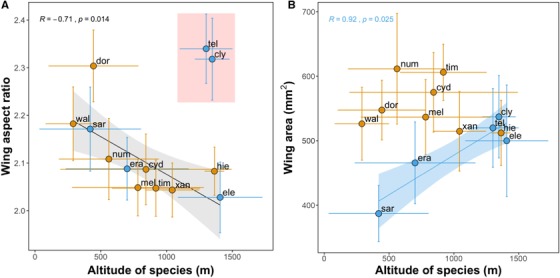
Figure 4.

Species variation in wing aspect ratio (A) and wing area (B). Plots show the effect of altitude (meters above sea level) on wing aspect ratio (major axis/minor axis, higher values represent longer wings) and wing area (mm2). Points represent species mean raw values per species. Horizontal and vertical lines show standard error for species mean altitude and mean trait, respectively. Lines show best linear fit and are colored by clade when clade was a significant predictor (blue: erato clade, orange: melpomene clade). Shaded areas show confidence bands at 1 standard error. The point labels correspond to the first three characters of the following Heliconius species: H. telesiphe, H. clysonymus, H. erato, H. eleuchia, H. sara, H. doris, H. xanthocles, H. hierax, amH. wallacei, H. numata, H. melpomene, H. timareta, and H. cydno. Two species, H. telesiphe and H. clysonymus, showed high levels of phylogenetic autocorrelation (Fig. S7) and were thus excluded from the linear model plotted (but not from the main analyses where phylogeny is accounted for). [Color figure can be viewed at http://wileyonlinelibrary.com]
