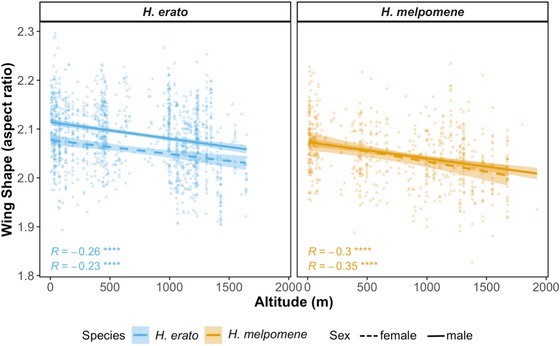
Figure 5.

Within‐species variation in wing aspect ratio across altitudes in H. erato (blue) and H. melpomene (orange), females (triangles, dotted line) and males (circles, solid line). Lines show best linear fit and are colored by species. Shaded areas show confidence bands at 1 standard error. Pearson correlation coefficients and P‐values are shown for each regression plotted. (•<0.1, * < 0.05, ** <0.01, *** <0.001). [Color figure can be viewed at http://wileyonlinelibrary.com]
