Figure 1.

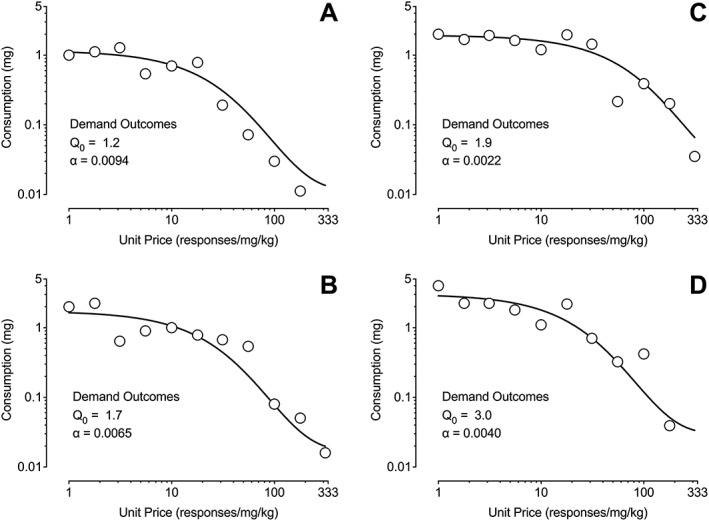
Representative individual subject plots. Depicted are behavioral economic demand curves for individual subjects. Also included are values from the exponentiated demand curve for unconstrained demand (Q 0) and demand elasticity (α)

Representative individual subject plots. Depicted are behavioral economic demand curves for individual subjects. Also included are values from the exponentiated demand curve for unconstrained demand (Q 0) and demand elasticity (α)