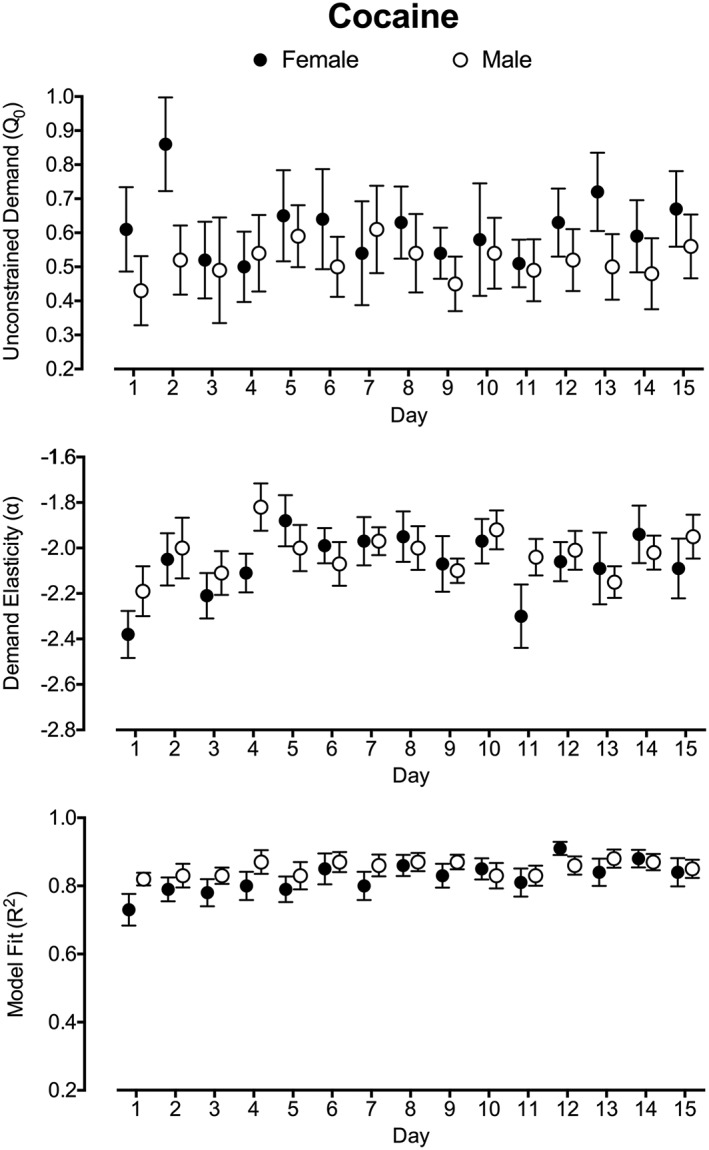
Figure 2.

Cocaine demand parameters across the 15‐d study period. Plotted are unconstrained demand (Q 0; top panel), demand elasticity (α; middle panel), and model fit (R 2; bottom panel) over the 15‐d period. Q 0 and α are plotted as the log‐transformed value to correct for substantive variable skew in data analysis. Plotted are mean values with standard error. Filled circles represent estimates for female subjects, and open circles represent estimates for male subjects
