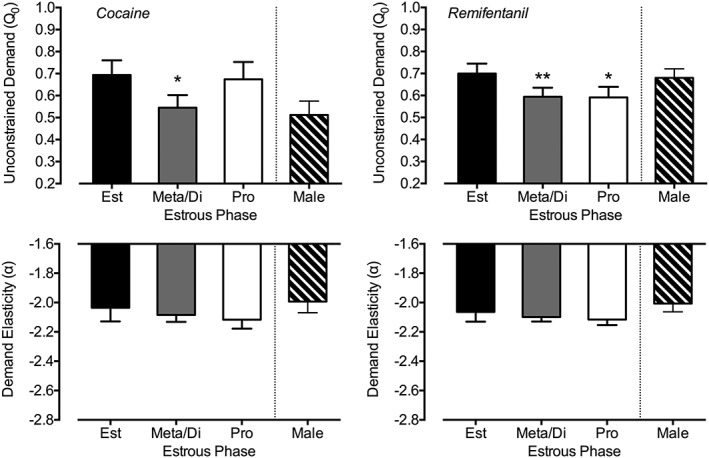
Figure 4.

Estrous cycle effects on unconstrained demand (Q 0; top panels) and demand elasticity (α; bottom panels). Plotted are estimates from linear mixed‐effect models predicting cocaine (left panels) and remifentanil (right panels) by estrous phase. Values represent estimated value during estrus (Est; black bar), meta/diestrus (Meta/Di; gray bar), and proestrus (Pro; white bar) with error bars as standard error. Also included are values for male subjects (crossed bar) derived from mixed models evaluating sex differences. Demand values are plotted as the modeled log‐transformed values. * P < 0.05; ** P < 0.01 comparing with estrous phase in female subjects
