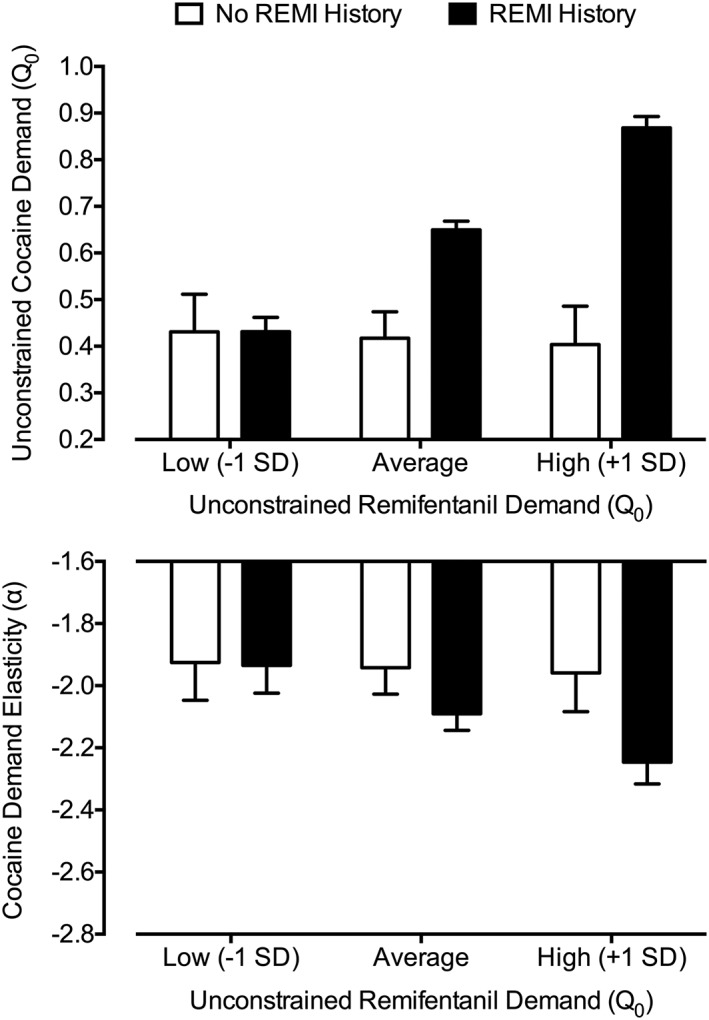
Figure 5.

Effect of remifentanil exposure history of on cocaine demand. Plotted are simple slope estimates from linear mixed‐effect models predicting unconstrained cocaine demand (top panel) and cocaine demand elasticity (bottom panel). Estimates were generated for a subject at the average unconstrained remifentanil demand value, one standard deviation below this average (low unconstrained demand) and one standard deviation above this average (high unconstrained demand). Plots depict the modeled relationship between varying levels of unconstrained remifentanil demand and recorded cocaine values. Subjects with a prior history of remifentanil exposure first completed threshold testing for remifentanil then cocaine (a significant relationship was observed for both outcomes). Subjects with no prior history first completed threshold testing for cocaine then remifentanil (no significant relationship was observed for both outcomes). Error bars represent standard error
