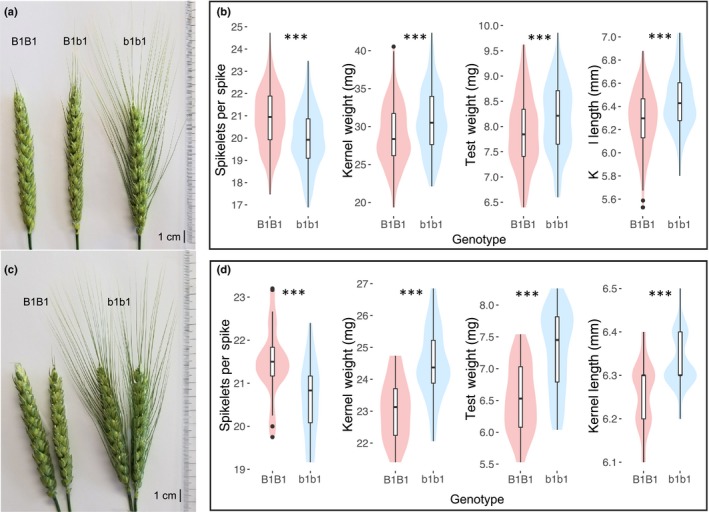
Figure 2.

Differences observed between awned and awnless recombinant inbred lines (RIL) and near isogenic lines (NIL) of wheat. (a) Spikes from a segregating field row from the LA95135 × SS‐MPV57 (L × M) RIL population show the effect of the mostly dominant Tipped1 (B1) allele. (b) Comparison of best linear unbiased estimates calculated for spikelets per spike, kernel weight, test weight and kernel length indicate differences between awned vs awnless lines in the L × M RIL population. Significant difference are indicated (***,P < 0.001). (c) Spikes for HIF‐derived NIL families 37‐14 (left) and 37‐3 (right), differing at the B1 locus. (d) The B1 NILs also differ significantly (***,P < 0.001) for all four traits in a highly replicated field experiment in Raleigh, NC in 2018.
