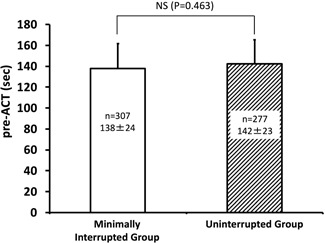
Figure 4.

Comparison of pre‐ACT values between the minimally interrupted (n = 307; open columns) and uninterrupted (n = 277; oblique line pattern) DOAC therapy groups. ACT, activated clotting time; DOAC, direct oral anticoagulants; NS, not significant; P, probability
