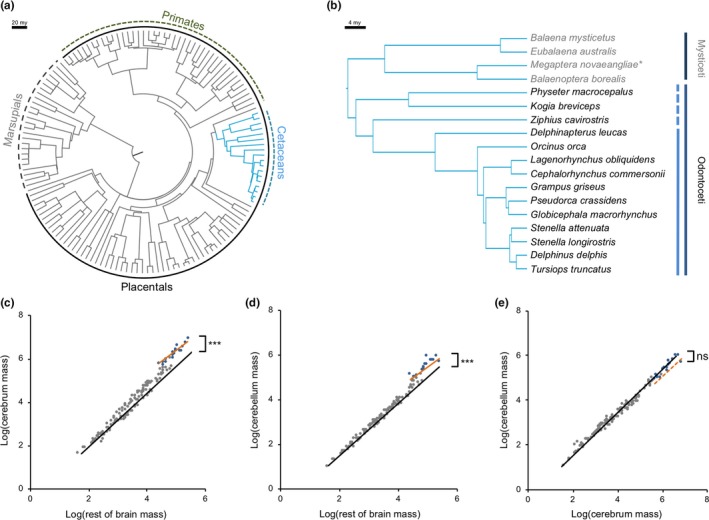
Figure 1.

Phylogeny of species included in this study. (a) The all mammal dataset. Inner dashed line shows marsupial mammals, and inner solid line shows placental mammals. Outer green dashed line shows primates, and outer blue dashed line and branches show cetaceans. (b) Cetacean phylogeny, showing major taxonomic groups. Within odontocetes, the dashed/solid lines distinguish Delphinoidea from other odontocetes. Data for Megaptera novaeangliae (*) are available but were excluded as the sum of CB and CX equalled total brain volume, suggesting the inclusion of other components. (c, d) Log–log plots of scaling between (c) CX and RoB, (d) CB and RoB, and (e) CB and CX for all mammals (grey points/black line) and cetaceans (blue points/orange line). ***Significant grade shifts between cetaceans and other mammals at p < .001, ns indicates nonsignificant grade shifts
