
Figure 4.
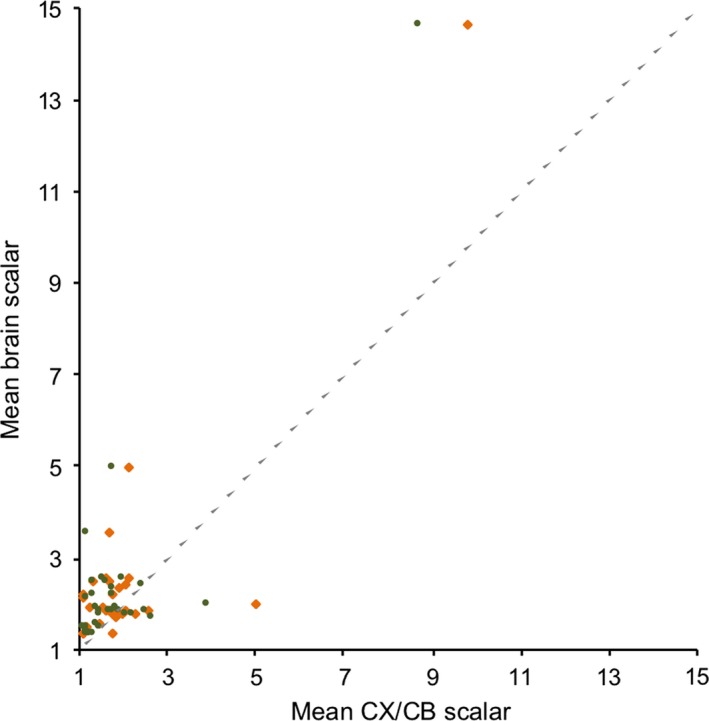
Mean scalars from the variable rates model for CB (orange) and CX (green), controlling for RoB, in cetaceans, plotted against the mean scalar for brain mass, controlling for body mass. The dashed line indicates a 1:1 relationship
Official websites use .gov
A
.gov website belongs to an official
government organization in the United States.
Secure .gov websites use HTTPS
A lock (
) or https:// means you've safely
connected to the .gov website. Share sensitive
information only on official, secure websites.
Mean scalars from the variable rates model for CB (orange) and CX (green), controlling for RoB, in cetaceans, plotted against the mean scalar for brain mass, controlling for body mass. The dashed line indicates a 1:1 relationship