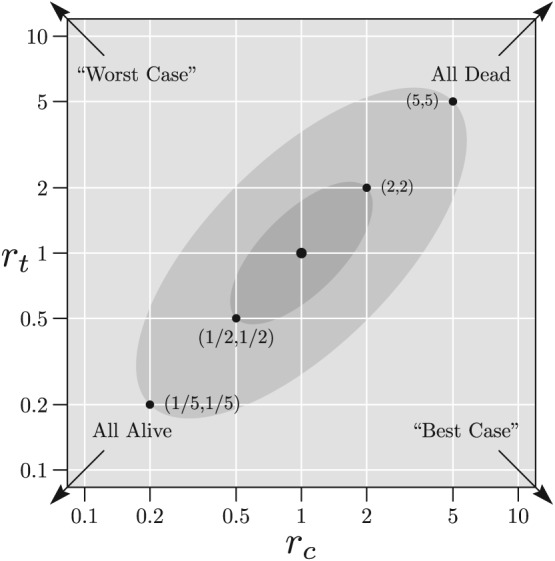
Figure 1.

Example plausible regions shown on and scales where the outcomes are “dead” (failure) and “alive” (success). The lightly shaded ellipse shows the “skeptical region” whose boundary lies between the points (1/5, 1/5) and (5, 5). The darker shaded ellipse shows the “optimistic region” whose boundary lies between the points (1/2, 1/2) and (2, 2). The point (1, 1) corresponds to missing at random
